 Learn About Structures
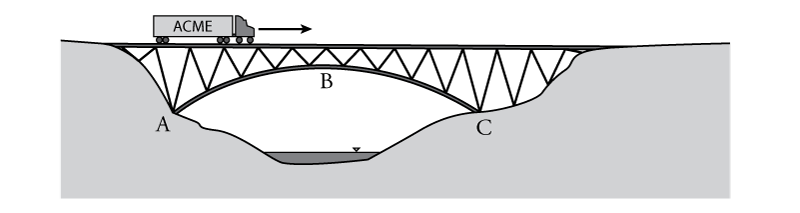
An influence line is a graphical tool that civil engineers may use to determine the effect of multiple different loads on a single structure. For example, the bridge shown in Figure 6.1 is a complex structure that will have many different loading cases. Even if we only look at the effect of a single truck travelling across the bridge (as shown in the figure), it is clear that the loads in all the bridge members will change as the truck moves from one side of the bridge to the other. The forces in the diagonal elements on the left side of the bridge near point A may be higher when the truck is on that side. The loads in the arch may be highest when the truck is near the middle of the bridge near point B.
It would be useful to be able to draw a diagram that shows what the effect of the moving load (truck) is for a single design element. For example, to design an axial member of the bridge, we can have a diagram that shows what the axial load on that single member is for all different possible locations of the truck. Likewise, we could have another diagram that shows the effect of the location of the truck on the shear force in a specific member. Such diagrams are called influence lines.
A sample structure (a beam) is shown with two such influence lines in Figure 6.2. This beam has a pin support at point A, and roller supports at points C and E. Although it has four reaction components, it is determinate due to the equation of condition provided by the internal hinge at point D. To draw the influence line, we will assume that there is a single vertical point load on the beam with a magnitude of $1\mathrm{\,kN}$ and that that point load may be located anywhere along the length of the beam. The location of the point load is represented by the variable $x$ (so $0 \leq x \leq 6\mathrm{\,m}$).
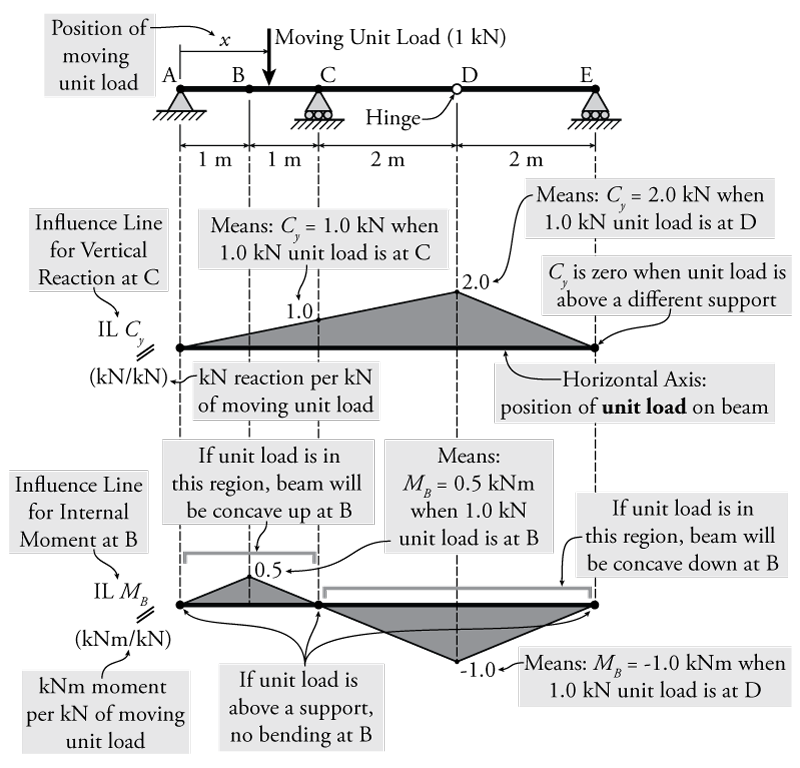
Two sample influence lines for this beam with the moving unit load are shown in Figure 6.2 below the beam itself. The first one, in the centre of the figure, is the influence line for the vertical reaction at point C ($C_y$). This diagram is labelled "IL $C_y$" to show that it is an influence line (IL) and not a shear or moment diagram. This influence line diagram shows what the vertical reaction $C_y$ is when the unit load is located at every point along the beam. The horizontal position along the influence line shows where the unit load is located along the beam, and the value of the influence line at that location represents the magnitude of the vertical reaction at C ($C_y$) when the point load is in that location. For example, this diagram shows that when the point unit load of $1\mathrm{\,kN}$ is located at point D, the vertical reaction at point C is equal to $2.0\mathrm{\,kN}$. This may easily be confirmed using equilibrium. Likewise, when the unit load is directly above point C, all of the load will transmit directly into the reaction support at C (and so $C_y = 1.0\mathrm{\,kN}$). Since all of the values on this influence line are positive, we know that, no matter where the unit load is located, the reaction at point C will always point upwards. When the point load is located directly above another support such as the support at A or the support at E, then all of the unit point load is transferred directly into that support and none is left to cause any vertical reaction at C (and so $C_y = 0$). Although the influence diagram for the reaction at C is the only reaction influence diagram shown in the figure, influence diagrams could similarly be constructed for the vertical reactions at A (IL $A_y$) and E (IL $E_y$).
The units for a reaction influence diagram are $\mathrm{kN/kN}$ because the value of the influence diagram at a given location along the beam represents the reaction $C_y$ at C (in $\mathrm{kN}$) per unit of point load that is applied at that location (if that is also provided in $\mathrm{kN}$); however, $\mathrm{kN/kN}$ is effectively unitless, so the same relationship would apply for any other load unit. The influence line for the reaction $C_y$ at C would be identical if the units were $\mathrm{N}$ force per unit of point load at that location in $\mathrm{N}$. The units could even be given as $\mathrm{lb/lb}$.
The diagram at the bottom of Figure 6.2 is the influence line for the internal moment in the beam at point B (IL $M_B$). Similar to the reaction influence line for $C_y$, the value of this moment influence line at each location along the beam represents the moment at point B (and only at point B, nowhere else), when a unit point load is applied at that location on the beam. For example, if a unit load is located at point D, then the internal moment in the beam at point B ($M_B$) will be equal to $-1.0\mathrm{\,kNm}$. The negative sign on this value indicates a negative internal moment, which, according to our sign convention (see Section 1.6), means that the beam will be concave downwards at point B. Likewise, if a unit load is applied at point B, then the moment at point B ($M_B$) will be positive $0.5\mathrm{\,kNm}$ (concave up). If the unit load is over a support (like at points A, C, and E), then all of the load goes directly into the support and, therefore, no moment is created at point B. This makes the internal moment influence line at those locations equal to zero.
The units for the internal moment influence diagram are $\mathrm{kNm/kN}$ because the value of the influence diagram at a given location along the beam represents the moment $M_B$ at point B (in $\mathrm{kNm}$) per unit of point load that is applied at that location (if that is provided in $\mathrm{kN}$). Since this parameter is not unitless, the actual units that are used will change the magnitude of the influence line values.
Since all of the influence lines shown in Figure 6.2 are linear, the values of the influence line at any location may be found using interpolation based on the maximum values and the dimensions shown on the diagrams.
The most important thing to remember about influence lines is that a single influence diagram only shows the influence of a moving load for a single specific parameter (e.g. reaction force, shear force or moment) at a single specific location in the structure. The x-axis of the influence diagram does not represent a beam, it represents the path of the moving unit load. For influence lines for beam, this path happens to coincide with the beam itself. But, as we will see, for more complex structures such as trusses or frames, the influence line cannot represent the entire structure, only the location of a moving load along a single specific linear path.