One way to construct an influence line is to simply move a point load in small increments along a path, and to plot the value of the influence parameter (e.g. reaction at a certain point) for each incremental location of the load. For each step, the magnitude of the parameter can be determined using equilibrium (with a full equilibrium analysis being done for each location of the moving point load).
This process may be simplified by finding equations for the influence lines as a function of the position along the path $x$. To do this, the influence lines for all of the reaction forces must usually be found first. Then influence lines for other parameters, such as shear and moment at different points in the beam, may then be found as functions of the influence lines for those reactions. This process will be illustrated in the example below.
Example
An example beam structure is shown in Figure 6.3. This is a simply supported beam with cantilever extensions at either end. Find the influence lines for the internal shear and moment at point C.
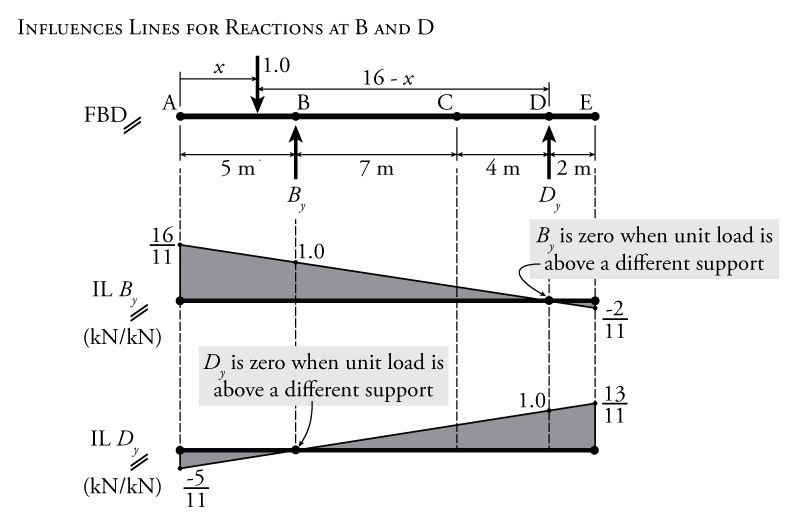
We cannot easily go straight to a solution for the internal shear and moment at point C because any free body diagram that we use to find those quantities will also include at least one reaction force (which we do not know and which is a function of the location of the moving unit point load. So, to find the influence lines for the shear and moment at a point, it is typically necessary to first find the influence lines for the structure's reaction forces. The final influence lines for the reaction forces are shown in Figure 6.4.
These influence lines for the reactions are calculated using equilibrium where the location of the moving unit point load is assumed to be a function of the position along it's path $x$ as shown in on the free body diagram at the top of Figure 6.4. For the reaction $B_y$ we can use a moment equilibrium around point D:
\begin{align*} \curvearrowleft \sum M_D &= 0 \\ -B_y (11) + 1.0(16 - x) &= 0 \\ B_y &= \frac{16}{11} - \frac{x}{11} \end{align*}
This equation for $B_y$ as a function of $x$ describes the influence line diagram (IL $B_y$) shown in the centre of Figure 6.4. The $1.0$ value in the equation above represents the moving unit point load. The moment caused by this point load depends on its location. That is why it is multiplied by $(16-x)$, which represents the moment arm distance between the moving unit load and the centre of moment at point D that we are using for the equilibrium equation. Notice that when the point load is located above point D, there is no reaction in $B_y$ since all of the load will go straight into the reaction support at D. Note also, that if $x=5$, then $B_y=1.0$ because when $x=5$, the point load is right above point B, and so the full value of the point load is transferred straight into the reaction at B.
Likewise for the influence line of the reaction $D_y$, we can now use vertical equilibrium:
\begin{align*} \uparrow \sum F_y &= 0 \\ B_y - 1.0 + D_y &= 0 \\ \left( \frac{16}{11} - \frac{x}{11} \right) -1.0 + D_y &= 0 \\ D_y &= \frac{x}{11} - \frac{5}{11} \end{align*}
+Again, this equation, which is a function of the point load position $x$, describes the influence line for the reaction at D (IL $D_y$) which is shown at the bottom of Figure 6.4. For this equilibrium expression, which includes the influence line equation for the other reaction $B_y$, we can just sub in the previous expression that we already determined for $B_y$ (as a function of $x$). The point load in this equation is not a function of $x$ because for the vertical equilibrium, there is no moment arm, so it doesn't matter where the unit point load is located. Note again that the influence line for $D_y$ is 0 when the unit load is above point B, and will be equal to 1.0 when the unit load is above point D (at $x=16$).
Now that we have influence lines for the reactions, with their associated equations in terms of the position of the moving unit load $x$, we can use those to find influence lines for the internal shear and moment at different points in the beam. We will now find these internal shear and moment influence lines for point C, which is at the middle of the beam span.
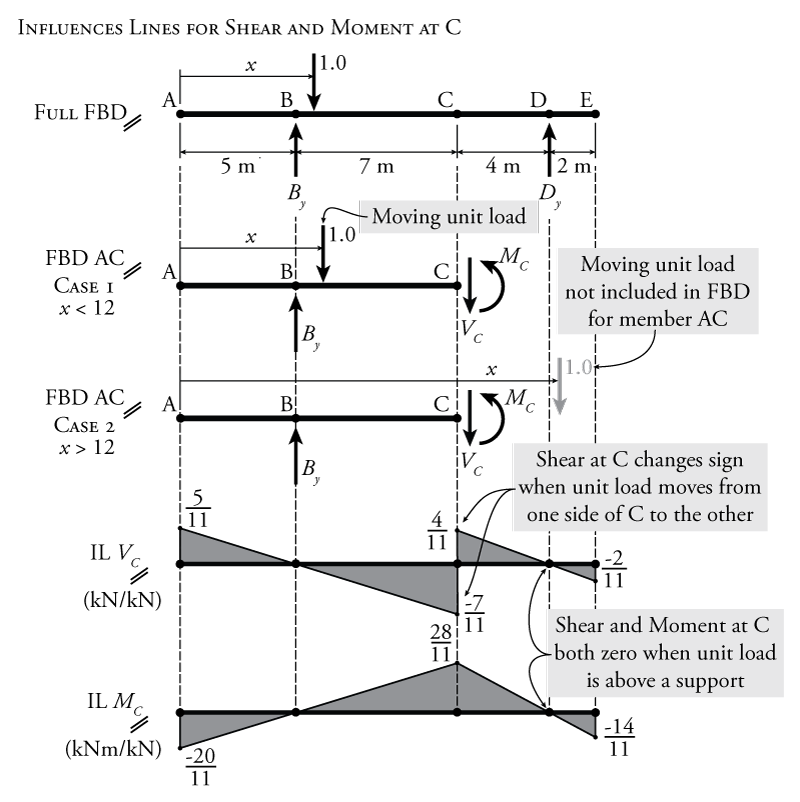
The free body diagram for the full beam is shown at the top of Figure 6.5. To find the influence lines for the moment and shear at C, we need to make a cut in the free body diagram at point C as shown in the figure. We can use the beam on either side of the cut to find the shear and moment using the equilibrium equations for the cut section of the beam. In Figure 6.5 a free body diagram for the piece of the beam on the left side of the cut is used. This free body diagram will be different depending on the location of the moving unit load. If the moving unit load is located to the left of point C (i.e. $x \leq 12$), it will be present on the free body diagram. If it is located to the right of point C (i.e. $x>12$), then it will not come into any equilibrium calculations for the left-side of the beam. Two separate free body diagrams are shown in Figure 6.5 to represent both of these cases.
Since the free-body diagram has two different cases, one for when the moving point load location $x < 12$ and one for when $x > 12$, we will have two different expressions for the shear and moment depending on those two possible locations of the point load. When the point load is location on the left side of the beam ($x<12$), the point load will come into the equilibrium equations. When the point load is on the right side of the beam ($x>12$), the point load will not be included in the equilibrium.
For Case 1 ($x<12$), the free body diagram is shown in Figure 6.5:
\begin{align*} \uparrow \sum F_y &= 0 \\ B_y - 1.0 - V_C &= 0 \\ V_C &= \frac{16}{11} - \frac{x}{11} - 1.0 \end{align*} \begin{equation*} \boxed{V_C = \frac{5}{11} - \frac{x}{11} \; \text{for} \; x < 12} \end{equation*}
This describes the influence line for the internal shear at point C for all the points along the path of the moving load when $x<12$. This is also equal to:
\begin{align*} V_C &= B_y - 1.0 \; \text{for} \; x < 12 \end{align*}
For the Case 1 moment:
\begin{align*} \curvearrowleft \sum M_C &= 0 \\ -B_y (7) + 1.0(12 - x) + M_C &= 0 \end{align*} \begin{equation*} \boxed{M_C = \frac{4x}{11} - \frac{20}{11} \; \text{for} \; x < 12} \end{equation*}
which describes the influence line for the internal moment at point C for all the points along the path of the moving load when $x<12$.
For Case 2 ($x>12$), the free body diagram is also shown in Figure 6.5:
\begin{align*} \uparrow \sum F_y &= 0 \\ B_y - V_C &= 0 \\ V_C &= B_y \end{align*} \begin{equation*} \boxed{V_C = \frac{16}{11} - \frac{x}{11} \; \text{for} \; x > 12} \end{equation*}
This describes the influence line for the internal shear at point C for all the points along the path of the moving load when $x>12$. The difference between this case and the previous calculation of the shear influence line is that this equilibrium does not contain any term caused by a unit point load. For the Case 2 moment:
\begin{align*} \curvearrowleft \sum M_C &= 0 \\ -B_y (7) + M_C &= 0 \\ M_C &= 7 B_y \end{align*} \begin{equation*} \boxed{M_C = -\frac{7x}{11} - \frac{112}{11} \; \text{for} \; x > 12} \end{equation*}
which describes the influence line for the internal moment at point C for all the points along the path of the moving load when $x>12$.
The resulting influence lines for internal shear and moment at point C (IL $V_C$ and IL $M_C$) are shown in Figure 6.5. These influence lines may be drawn easily based on the equations above. The easiest way to draw them is to determine the values of the influence diagrams at the ends $x=0$, $x=12$ and $x=18$ by plugging those values into the equations for $V_C$ and $M_C$. Notice from these diagrams that the value of the shear and moment at C are equal to zero whenever the moving unit load is directly above a support location (because in that case, all of the load goes directly into the support and cannot cause shear and moment in the beam). It is also important to notice that the shear influence line has two different values at point C, $-\frac{7}{11}$ and $+\frac{4}{11}$. These represent the values of the shear at point C when the unit load is just to the left of point C and just to the right of point C, respectively. There is no defined value for shear at point C when the unit load is exactly at point C.
 Learn About Structures

